
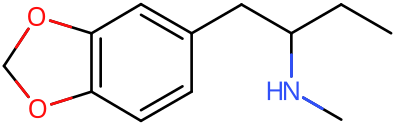
MBDB Stats & Data
CCC(CC1=CC2=C(C=C1)OCO2)NCUSWVWJSAJAEEHQ-UHFFFAOYSA-NEffect Profile
Curated + 13 ReportsMild visuals with strong body load, low headspace
Moderate stimulation, sensory enhancement, and euphoria with low empathy
Moderate stimulation and euphoria with strong anxiety/jitters, mild focus
Tolerance & Pharmacokinetics
drugs.wikiTolerance Decay
Experience Report Analysis
ErowidDemographics
Gender Distribution
Too few reports for a chart: gender is known from 15 reports, and a split is drawn only from 20 reports or more. Counts are shown instead. Why 20?
- Male 15 of 15
Reports Over Time
Effect Analysis
ErowidEffects aggregated from 13 experience reports (13 single-substance Erowid)
Effect Sentiment Distribution
Confidence Distribution
Each bar is the share of reports mentioning the effect; its whisker, and the band on the rows below, is the 95% interval: where the share could plausibly be with other reports of the same kind.
Too few reports for bars: these effects come from 13 single-substance Erowid reports, and a bar is drawn only from 20 reports or more. With fewer, a percentage cannot tell a common effect from a rare one. Counts are shown instead. Why 20?
Positive Effects 9
Adverse Effects 6
Show 2 neutral or unclassified mentions
Real-World Dose Distribution
ErowidFrom 14 of 19 recorded dose entries: those that state a weight (mg, g or µg), in routes with at least five of them. Values above Q3 + 3×IQR, far above what people typically take, are left out; they can include real heavy doses and overdoses, not only mistakes.
Oral (n=13)
Form / Preparation
Most common forms and preparations, as a share of the 13 reports that give one
Too few reports for bars: these forms come from 13 reports, and a bar is drawn only from 20 reports or more. With fewer, a percentage cannot tell a common effect from a rare one. Counts are shown instead. Why 20?
- Powder / Crystals 10 of 13
- Capsule 2 of 13
Body-Weight Dosing
Dose per kg of body weight, one dose per report (the first listed), from reports giving a weight of 30–250 kg. Doses above Q3 + 3×IQR, far above what people typically take, are left out of the median and range and listed under each route.
Redose Patterns
Redosing behavior across 13 reports
Too few reports for a chart: redosing is known from 13 reports, and a split is drawn only from 20 reports or more. Counts are shown instead. Why 20?
- Single dose 10 of 13
- Redosed 3 of 13