
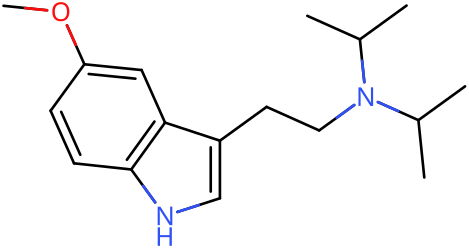
5-MeO-DiPT Stats & Data
DNBPMBJFRRVTSJ-UHFFFAOYSA-NPharmacology
DrugBankDescription
5-methoxy-N,N-diisopropyltryptamine (5-MeO-DIPT) is a tryptamine derivative and shares many similarities with schedule I tryptamine hallucinogens such as alpha-ethyltryptamine, N,N-dimethyltryptamine, N,N-diethyltryptamine, bufotenine, psilocybin and psilocin. Since 1999, there has been a growing popularity of 5-MeO-DIPT among drug abusers. This substance is abused for its hallucinogenic effects.
Pharmacodynamics
5-methoxy-diisopropyltryptamine, also known as 5-methoxy-N,N-diisopropyltryptamine, 5-MeO-DiPT, foxy methoxy, or just foxy, is a tryptamine that is used recreationally as a psychedelic. 5-MeO-DiPT is orally active, and dosages between 6–20 mg are commonly reported. Many users note an unpleasant body load accompanies higher dosages. 5-MeO-DiPT is also taken by insufflation, or sometimes it is smoked or injected. Some users also report sound distortion, also noted with the related drug, DiPT.
Absorption
5-MeO-DIPT produces effects with an onset of 20 to 30 minutes and with peak effects occurring between 1 to 1.5 hours after administration.
Receptor Profile
Receptor Actions
History & Culture
5-MeO-DiPT was first synthesized and tested by American chemist Alexander Shulgin, who conducted the initial human trials of the compound in 1975. Shulgin subsequently co-authored a paper with M. F. Carter detailing the synthesis and human psychopharmacology of both 5-MeO-DiPT and its parent compound diisopropyltryptamine (DiPT), which was published in 1980. A more comprehensive summary of the synthesis procedure and extensive reports of human use later appeared in Shulgin's 1997 book TiHKAL (Tryptamines I Have Known and Loved). The compound first appeared as a novel designer drug in 1999, emerging in recreational drug markets where it gained the street name "Foxy" or "Foxy Methoxy." It has been used recreationally as a party drug and is noted for its reported aphrodisiac and tactile-enhancing properties. The substance has seen particular use in chemsex contexts, with notable prevalence among gay men and transgender women seeking its reputed sexual enhancement effects.
Toxicity
PsychonautWikiThe long-term health effects of recreational 5-MeO-DiPT use do not seem to have been studied in any scientific context, and the exact toxic dose is unknown. This is because 5-MeO-DiPT is a research chemical with very little history of human usage. The neurotoxic effects have been studied in rats. Anecdotal reports suggest that there are no negative health effects attributed to simply trying it by itself at low to moderate doses or using it very sparingly (but nothing can be completely guaranteed). Independent research should always be done to ensure that a combination of two or more substances is safe before consumption.
Overdose
Excessive doses have caused nausea, vomiting, agitation, decreased blood pressure, pupil dilation, increased heart rate, and hallucinations in a number of young adults. Rhabdomyolysis and renal failure occurred in one young man, and another one died 3–4 hours after an apparent rectal overdose. A 24-year-old man also died of this compound being administered into the colon.
Effect Profile
Curated + 217 ReportsStrong visuals, auditory effects, and headspace with strong body load
Strong euphoria, stimulation, and sensory enhancement with mild empathy
Strong euphoria with strong anxiety/jitters, moderate stimulation, low focus
Duration Timeline
BluelightEmpirical Duration
Erowid ReportsMedian times after the dose that Erowid reports state. A curve is drawn only when reports state all four points (onset, peak begins, comedown begins, back to baseline) and the medians fall in that order. No point is estimated from another.
No curve: the stated times run backwards. Reports put the return to baseline (T+3.5h, 6 reports) before the start of the comedown (T+3.9h, 8 reports). Each time is the median of a different set of reports, so they are shown as stated, not rearranged.
Community Effects
TripSitTolerance & Pharmacokinetics
drugs.wikiTolerance Decay
Cross-Tolerances
Demographics
Gender Distribution
Age Distribution
Reports Over Time
Effect Analysis
Erowid + BluelightEffects aggregated from 208 experience reports (158 single-substance Erowid + 59 Bluelight)
Effect Sentiment Distribution
Confidence Distribution
Each bar is the share of reports mentioning the effect; its whisker, and the band on the rows below, is the 95% interval: where the share could plausibly be with other reports of the same kind.
Positive Effects 68
Adverse Effects 61
Show 39 more adverse effects
Show 27 neutral or unclassified mentions
Also reported in combinations. In the 109 5-MeO-DiPT reports where another drug was taken too, 14 (12.8%) mention hospital, emergency services or an overdose, 3 (2.8%) a seizure and 5 (4.6%) psychosis. In the 158 single-substance reports: 10.1%, 2.5% and 5.1%. These are not in the figures above: they cannot be put down to 5-MeO-DiPT alone, and a mention is not always something that happened to the writer.
Dose-Response Correlation
How effect frequency changes across dose levels. Whiskers, and the numbers' hover text, give each figure's 95% interval.
Not drawn, too few reports (a dose tier needs 20): Oral Light (n=19), Oral Strong (n=10). Why 20?
View data table
| Effect | Common (n=35) | Heavy (n=24) |
|---|---|---|
| Visual Distortions | 65.7% (95% interval 49 to 79 percent) | 79.2% (95% interval 60 to 91 percent) |
| Music Enhancement | 68.6% (95% interval 52 to 81 percent) | 20.8% (95% interval 9 to 40 percent) |
| Anxiety | 40.0% (95% interval 26 to 56 percent) | 66.7% (95% interval 47 to 82 percent) |
| Stimulation | 51.4% (95% interval 36 to 67 percent) | 25.0% (95% interval 12 to 45 percent) |
| Color Enhancement | 51.4% (95% interval 36 to 67 percent) | 45.8% (95% interval 28 to 65 percent) |
| Auditory Effects | 40.0% (95% interval 26 to 56 percent) | 33.3% (95% interval 18 to 53 percent) |
| Confusion | 31.4% (95% interval 19 to 48 percent) | 37.5% (95% interval 21 to 57 percent) |
| Euphoria | 34.3% (95% interval 21 to 51 percent) | 29.2% (95% interval 15 to 49 percent) |
| Hospital | — | 33.3% (95% interval 18 to 53 percent) |
| Muscle Tension | 31.4% (95% interval 19 to 48 percent) | 8.3% (95% interval 2 to 26 percent) |
| Empathy | 25.7% (95% interval 14 to 42 percent) | 16.7% (95% interval 7 to 36 percent) |
| Sedation | 22.9% (95% interval 12 to 39 percent) | 25.0% (95% interval 12 to 45 percent) |
| Nausea | 20.0% (95% interval 10 to 36 percent) | 25.0% (95% interval 12 to 45 percent) |
| Tactile Enhancement | 20.0% (95% interval 10 to 36 percent) | 20.8% (95% interval 9 to 40 percent) |
| Body High | 20.0% (95% interval 10 to 36 percent) | 20.8% (95% interval 9 to 40 percent) |
Subjective Effect Ontology
Experience ReportsStructured effect tags extracted from 317 Erowid & Bluelight experience reports using a controlled vocabulary of 220+ canonical effects across 15 domains.
Auditory
Emotional
Gastrointestinal
Motor
Tactile
Visual
Dose–Effect Mapping
Experience ReportsHow reported effects shift across dose tiers, based on 158 single-substance experience reports. The shaded band on each bar is its 95% interval. An arrow (↑ ↓) marks a change between the lowest and highest tier that count an effect only when the gap is bigger than chance would explain; ~ means no clear change. How changes are called
Not drawn, too few reports (a dose tier needs 20): Oral Light (n=19), Oral Strong (n=10). Why 20?
Limited tier coverage — most reports fall within the Common / Heavy range. Effects at other dose levels may not be represented.
| Effect | Common (n=35) | Heavy (n=24) | Change with dose |
|---|---|---|---|
| visual distortions | (no clear change: +14 points from Common to Heavy, 95% interval −10 to +34) | ||
| music enhancement | (−48 points from Common to Heavy, 95% interval −65 to −22) | ||
| anxiety | (+27 points from Common to Heavy, 95% interval +1 to +48) | ||
| stimulation | (−26 points from Common to Heavy, 95% interval −47 to −1) | ||
| color enhancement | (no clear change: −6 points from Common to Heavy, 95% interval −29 to +19) | ||
| auditory effects | (no clear change: −7 points from Common to Heavy, 95% interval −29 to +18) | ||
| confusion | (no clear change: +6 points from Common to Heavy, 95% interval −17 to +30) | ||
| euphoria | (no clear change: −5 points from Common to Heavy, 95% interval −27 to +19) | ||
| hospital | — | counted in the Heavy tier only | |
| muscle tension | (−23 points from Common to Heavy, 95% interval −41 to −1) | ||
| empathy | (no clear change: −9 points from Common to Heavy, 95% interval −28 to +13) | ||
| sedation | (no clear change: +2 points from Common to Heavy, 95% interval −19 to +25) | ||
| nausea | (no clear change: +5 points from Common to Heavy, 95% interval −16 to +27) | ||
| tactile enhancement | (no clear change: +1 points from Common to Heavy, 95% interval −19 to +23) | ||
| body high | (no clear change: +1 points from Common to Heavy, 95% interval −19 to +23) | ||
| psychosis | — | counted in the Heavy tier only | |
| dissociation | (no clear change: −3 points from Common to Heavy, 95% interval −22 to +18) | ||
| closed-eye visuals | (no clear change: −12 points from Common to Heavy, 95% interval −29 to +8) | ||
| introspection | (no clear change: −5 points from Common to Heavy, 95% interval −22 to +16) | ||
| open-eye visuals | (no clear change: −5 points from Common to Heavy, 95% interval −22 to +16) |
Showing top 20 of 30 effects
Risk Escalation
Sentiment AnalysisAverage frequency of positive vs adverse effects across dose tiers. A tier's average is the mean share of the effects counted in that tier, not a share of reports, and its range is a deliberately wide 95% interval. A tier with more reports also counts rarer effects, which pulls its average down, so compare single effects in the breakdown rather than these averages. There, the shaded band on each bar is its 95% interval, and Change is marked up or down only when the gap between two tiers is bigger than chance would explain. How changes are called
Not drawn, too few reports (a dose tier needs 20): Light (n=19), Strong (n=10). Why 20?
View effect breakdown
Adverse Effects
| Effect | Common (n=35) | Heavy (n=24) | Change |
|---|---|---|---|
| Anxiety | +27 pts (+27 points from Common to Heavy, 95% interval +1 to +48) | ||
| Confusion | no clear change (no clear change: +6 points from Common to Heavy, 95% interval −17 to +30) | ||
| Muscle Tension | −23 pts (−23 points from Common to Heavy, 95% interval −41 to −1) | ||
| Nausea | no clear change (no clear change: +5 points from Common to Heavy, 95% interval −16 to +27) | ||
| Psychosis | — | — | |
| Memory Suppression | no clear change (no clear change: +11 points from Common to Heavy, 95% interval −5 to +31) | ||
| Sweating | — | — | |
| Jaw Clenching | — | — | |
| Motor Impairment | — | — | |
| Headache | — | — | |
| Pupil Dilation | no clear change (no clear change: −0.3 points from Common to Heavy, 95% interval −15 to +18) | ||
| Increased Heart Rate | — | — |
Positive Effects
| Effect | Common (n=35) | Heavy (n=24) | Change |
|---|---|---|---|
| Visual Distortions | no clear change (no clear change: +14 points from Common to Heavy, 95% interval −10 to +34) | ||
| Music Enhancement | −48 pts (−48 points from Common to Heavy, 95% interval −65 to −22) | ||
| Stimulation | −26 pts (−26 points from Common to Heavy, 95% interval −47 to −1) | ||
| Color Enhancement | no clear change (no clear change: −6 points from Common to Heavy, 95% interval −29 to +19) | ||
| Euphoria | no clear change (no clear change: −5 points from Common to Heavy, 95% interval −27 to +19) | ||
| Empathy | no clear change (no clear change: −9 points from Common to Heavy, 95% interval −28 to +13) | ||
| Tactile Enhancement | no clear change (no clear change: +1 points from Common to Heavy, 95% interval −19 to +23) | ||
| Body High | no clear change (no clear change: +1 points from Common to Heavy, 95% interval −19 to +23) | ||
| Closed-Eye Visuals | no clear change (no clear change: −12 points from Common to Heavy, 95% interval −29 to +8) | ||
| Introspection | no clear change (no clear change: −5 points from Common to Heavy, 95% interval −22 to +16) | ||
| Open-Eye Visuals | no clear change (no clear change: −5 points from Common to Heavy, 95% interval −22 to +16) | ||
| Focus Enhancement | — | — | |
| Creativity Enhancement | — | — |
Dosage Distribution
Dose distribution from experience reports, one dose per report (the first listed). Doses above Q3 + 3×IQR, far above what people typically take, are left out of the median and range and listed under each route: most are real heavy doses or overdoses, not mistakes.
Oral
8 reports gave a dose above the typical range (50–200 mg), so they are not in the figures above. 4 of them mention hospital, emergency services or an overdose. Listing a dose here does not mean it is safe.
Show the reports
- 200 mg · another drug taken too
- 100 mg
- 60 mg · another drug taken too · mentions hospital, emergency services or an overdose
- 60 mg · mentions hospital, emergency services or an overdose
- 56 mg
- 50 mg · another drug taken too · mentions hospital, emergency services or an overdose
- 50 mg · another drug taken too
- 50 mg · another drug taken too · mentions hospital, emergency services or an overdose
Insufflated
Real-World Dose Distribution
ErowidFrom 339 of 361 recorded dose entries: those that state a weight (mg, g or µg), in routes with at least five of them. Values above Q3 + 3×IQR, far above what people typically take, are left out; they can include real heavy doses and overdoses, not only mistakes.
Oral (n=265)
Insufflated (n=39)
Smoked (n=9)
Intravenous (n=5)
Intramuscular (n=6)
Common Combinations
Most co-occurring substances, as a share of all 267 reports filed under 5-MeO-DiPT; whiskers are 95% intervals
Form / Preparation
Most common forms and preparations, as a share of the 200 reports that give one; whiskers are 95% intervals
Body-Weight Dosing
Dose per kg of body weight, one dose per report (the first listed), from reports giving a weight of 30–250 kg. Doses above Q3 + 3×IQR, far above what people typically take, are left out of the median and range and listed under each route.
Oral
8 reports gave a dose above the typical range (0.689–2.941 mg/kg), so they are not in the figures above. 4 of them mention hospital, emergency services or an overdose. Listing a dose here does not mean it is safe.
Show the reports
- 2.941 mg/kg · another drug taken too
- 1.259 mg/kg
- 1.058 mg/kg · another drug taken too · mentions hospital, emergency services or an overdose
- 0.912 mg/kg · mentions hospital, emergency services or an overdose
- 0.797 mg/kg
- 0.787 mg/kg · another drug taken too · mentions hospital, emergency services or an overdose
- 0.787 mg/kg · another drug taken too · mentions hospital, emergency services or an overdose
- 0.689 mg/kg · another drug taken too
Insufflated
Redose Patterns
Redosing behavior across 210 reports
Legal Status
| Country | Status | Notes |
|---|---|---|
| Brazil | Illegal | Listed on Portaria SVS/MS nº 344. Possession, production, and sale are prohibited under national health surveillance regulations. |
| Canada | Unscheduled | Not listed in Canada's schedules of controlled substances under the Controlled Drugs and Substances Act (CDSA) as of available documentation. |
| China | Category I psychotropic substance | Controlled substance as of October 2015. Sale, purchase, import, export, and manufacture are prohibited under SFDA regulations. |
| Denmark | Illegal | Controlled since February 20, 2004. Possession outside of licensed research and medical contexts is prohibited. |
| Finland | Illegal | Banned in December 2014 under government regulations that prohibited over 100 psychoactive substances. |
| Germany | Anlage I BtMG | Listed in Schedule I of the Betäubungsmittelgesetz (Narcotics Act) since October 10, 2000. Manufacturing, possession, import, export, purchase, sale, and dispensing without license are prohibited. |
| Greece | Controlled substance | Designated a controlled substance on February 18, 2003 under national drug control legislation. |
| Japan | Controlled substance | Prohibited since April 17, 2005 under Japanese drug control laws. |
| Latvia | Illegal | Classified as a controlled substance under Latvian national drug legislation. |
| New Zealand | Class C (analogue) | May be treated as a Class C controlled drug under analogue provisions due to structural similarity to DMT. |
| Singapore | Class A | Controlled as a Class A substance since early 2006. Trafficking penalties include imprisonment ranging from 5 to 20 years and caning. |
| Sweden | Illegal (health hazard) | Classified as a 'health hazard' under Lagen om förbud mot vissa hälsofarliga varor since October 1, 2004 via regulation SFS 2004:696. Sale and possession are prohibited. |
| Switzerland | Controlled (Verzeichnis E) | Specifically named as a controlled substance under Verzeichnis E of Swiss narcotics regulations. |
| United Kingdom | Class A | Controlled under the Misuse of Drugs Act 1971 as an ether of 5-HO-DiPT, which falls under the tryptamine catch-all clause. Class A substances carry the most severe penalties. |
| United States | Schedule I | Emergency scheduled by the DEA on April 4, 2003, then formally placed into Schedule I of the Controlled Substances Act on September 29, 2004. Manufacturing, possession, buying, selling, and distribution require a DEA license. |
References
Cited References
- Bluelight: The Big & Dandy 5-MeO-DiPT Thread
- Erowid: 5-MeO-DiPT Vault
- Erowid TiHKAL Entry #37: 5-MeO-DiPT
- Noworyta-Sokolowska et al. (2016). Neurotoxic Effects of 5-MeO-DIPT
- Ray, T. S. (2010). Psychedelics and the Human Receptorome
- Shulgin, A. T.; Carter, M. F. (1980). N,N-Diisopropyltryptamine and 5-MeO-DiPT
- TripSit: Drug Combinations Wiki
- US DEA Drug Fact Sheet: 5-MeO-DiPT
- Shulgin, A. T.; Carter, M. F. (1980). Communications in Psychopharmacology
- Noworyta-Sokolowska et al. (2016). Neurotoxicity Research