
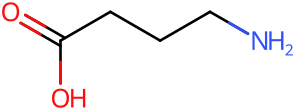
GABA Stats & Data
BTCSSZJGUNDROE-UHFFFAOYSA-NPharmacology
DrugBankDescription
The most common inhibitory neurotransmitter in the central nervous system.
Measured Affinities
Guide to PHARMACOLOGYMeasured binding and functional data for GABA, curated by the IUPHAR/BPS Guide to PHARMACOLOGY. Each row cites the paper it came from. Lower concentrations mean tighter binding — a value in the sub-nanomolar range indicates a very potent interaction.
| Target | Action | Measure | Value | Concentration | Species | Source |
|---|---|---|---|---|---|---|
| GABAB receptor Gabbr1|Gabbr2|Kctd8|Kctd12|Kctd16 | Full agonist | pIC50 | 8.3 | 5.01 nM | Rat | — |
| GABAB receptor GABBR1|GABBR2|KCTD8|KCTD12|KCTD16 | Full agonist | pKi | — | — | Human | — |
| GABAB1 Gabbr1 | Full agonist | pIC50 | — | — | Rat | PMID 9069281 |
| Glycine Receptor (All subtypes) | Partial agonist | pEC50 | — | — | Rat | — |
Reading this. pKi, pEC50 and pIC50 are negative log molar values, so a higher number means a tighter interaction; the concentration column converts them for you. Values from non-human species are laboratory measurements and do not translate directly to human effect. Receptor affinity is not a dose — it describes what a molecule binds, not how much of it is safe to take.
Receptor data from the IUPHAR/BPS Guide to PHARMACOLOGY (v2026.2), licensed CC BY-SA 4.0. Matched to this substance by InChIKey.
Toxicity
PubChemCarcinogenicity
No indication of carcinogenicity to humans (not listed by IARC).
Health effects (PubChem excerpts)
Chronically high levels of GABA are associated with at least 5 inborn errors of metabolism including: D-2-Hydroxyglutaric Aciduria, 4-Hydroxybutyric Aciduria/Succinic Semialdehyde Dehydrogenase Deficiency, GABA-Transaminase Deficiency, Homocarnosinosis and Succinic semialdehyde dehydrogenase deficiency.
Tolerance & Pharmacokinetics
drugs.wikiTolerance Decay
Experience Report Analysis
ErowidDemographics
Gender Distribution
Too few reports for a chart: gender is known from 10 reports, and a split is drawn only from 20 reports or more. Counts are shown instead. Why 20?
- Male 8 of 10
- Female 1 of 10
- Not Specified 1 of 10
Age Distribution
Reports Over Time
Real-World Dose Distribution
ErowidFrom 11 of 17 recorded dose entries: those that state a weight (mg, g or µg), in routes with at least five of them. Values above Q3 + 3×IQR, far above what people typically take, are left out; they can include real heavy doses and overdoses, not only mistakes.
Oral (n=11)
Form / Preparation
Most common forms and preparations, as a share of the 6 reports that give one
Too few reports for bars: these forms come from 6 reports, and a bar is drawn only from 20 reports or more. With fewer, a percentage cannot tell a common effect from a rare one. Counts are shown instead. Why 20?
- Powder / Crystals 4 of 6