
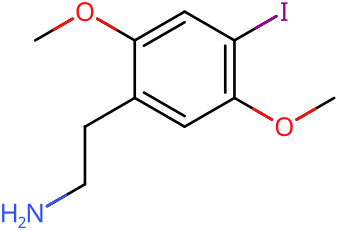
2C-I Stats & Data
COC1=CC(=C(C=C1CCN)OC)IPQHQBRJAAZQXHL-UHFFFAOYSA-NPharmacology
DrugBankDescription
2C-I is a lesser known psychedelic of the substituted phenethylamine class. In the early 2000s, 2C-I was sold in Dutch smart shops after the drug 2C-B was banned.
Receptor Profile
Receptor Actions
History & Culture
1976–1991
2C-I was first synthesized and investigated for human activity by Alexander Shulgin in the mid-to-late 1970s. The compound was initially described in scientific literature in 1977, with its properties and effects in humans documented the following year. Shulgin later provided a more comprehensive account of his research with 2C-I in his 1991 book PiHKAL (Phenethylamines I Have Known and Loved), which brought the substance to wider public awareness within psychedelic research communities. The presence of a heavy iodine atom in the molecule made 2C-I particularly suitable for radio-labeling experiments. The compound has been synthesized with radioactive iodine for research purposes, though more extensive radiological findings have emerged from studies using its three-carbon amphetamine analog, DOI.
1995–2004
2C-I began to emerge as a recreational substance in the late 1990s, initially gaining popularity in Dutch smart shops where it was sold as a legal alternative to 2C-B following that compound's scheduling in 1995. The substance became more widely available through grey market online vendors around 2002, marketed as a "research chemical" alongside other novel psychoactive substances. Distribution significantly declined after a series of DEA enforcement actions in 2004 that targeted vendors selling research chemicals intended for human consumption. Throughout its period of availability, 2C-I was sometimes confused with the structurally related but considerably more potent compound 25I-NBOMe, which media outlets subsequently nicknamed "Smiles." This confusion has contributed to ongoing concerns about accurate identification and appropriate harm reduction information for users.
Subjective Effects
Physical
- Spontaneous tactile sensations: The body high of 2C-I is manifested as one of the most proportionally intense in comparison to almost all of the classical psychedelics. The sensation itself can be described as an intense and slightly uncomfortable energetic pins and needles sensation that constantly encompasses a person's entire body. It is usually felt over every square inch of the skin but occasionally manifests itself in the form of a continuously shifting tingling sensation that travels up and down the body in spontaneous waves. Alongside of this, many users commonly report that the body high can be particularly uncomfortable and sometimes accompanied by dysphoric aches and urges to shift the position of one's body and prolonged tensing of unusual combinations of muscle groups.
- Physical euphoria: Feelings of frequent but unpredictable rushes of warm physical euphoria are extremely common and very pleasurable. These move from the top of the head downwards before enveloping one's whole body.
- Stimulation: In terms of its effects on the physical energy levels of the tripper, 2C-I is usually considered to be very energetic and stimulating in a fashion that is quite comparable to that of MDMA although encouraged instead of forced.
- Increased bodily control
- Tactile enhancement
- Nausea: Mild to extreme nausea is consistently reported when consumed in moderate to high dosages and either passes once the tripper has vomited or gradually fades by itself as the peak sets in.
- Temperature regulation loss
- Headaches: Some users report mild but uncomfortable head pressures which can occasionally intensify during the offset of the experience.
Cognitive
The head space of 2C-I is described by many as one which is relatively normal in its thought processes even at moderate to high dosages. It is often said to lack insight when compared to that of 2C-E, 2C-B and LSD.
- Empathy, love and sociability enhancement: This component is consistently manifested only in the context of social settings in which one is within the company of others. These feelings of sociability, love and empathy are a little weaker and less sharp than those found on substances such as MDMA and 2C-B but still prove strong enough to provide long lasting therapeutic effects.
- Time distortion
- Feelings of fascination, importance and awe
- Sexual arousal
- Current mind state enhancement
- Ego suppression, loss and death
- Unity and interconnectedness
Sensory
- Enhancements
- Distortions
- Hallucinations
- Visual drifting: (Melting, Flowing, Breathing and Morphing) - In comparison to other psychedelics, this effect can be described as simplistic and bland in detail, slow and smooth but sometimes jittery in motion, static in appearance and unrealistic/cartoon-like in style.
- Tracers
- Symmetrical texture repetition: In comparison to other psychedelics such as LSD and 2C-E this particular effect is bland and simplistic.
- Colour shifting
- Scenery slicing
- Increased visual acuity
- Enhancement of colour
- Enhanced pattern recognition
Like LSD, while 2C-I is capable of producing a full range of low and high level hallucinatory states, this is extremely rare and inconsistent at higher levels but common at lower levels.
- External hallucinations: The experience of effects such as open eye transformations are common within 2C-I but not consistent.
- Internal hallucinations: Although 2C-I is technically capable of producing hallucinatory states in a fashion that is on par with psilocin or DMT in its vividness and intensity, in comparison, these effects are extremely rare and inconsistent. Whilst traditional psychedelics such as LSA, ayahuasca and mescaline will induce internal hallucinations near consistently at level 5 geometry and above, 2C-I hallucinations will not extend beyond imagery and higher dosages will for most simply go straight into Level 7A visual geometry. This lack of consistently induced hallucinatory breakthroughs means that for most, 2C-I is simply not as deep of an experience as certain other psychedelics.
Forked from Subjective Effect Documentation by Josie Kins, March 2014. Via dose.wiki (CC0).
Toxicity
PsychonautWikiThe toxicity and long-term health effects of recreational 2C-I use do not seem to have been studied in any scientific context and the exact toxic dose is unknown. This is because 2C-I is a research chemical with very little history of human usage. Anecdotal reports from those who have tried 2C-I suggests that there are no negative health effects attributed to simply trying the substance by itself at low to moderate doses and using it very sparingly (but nothing can be completely guaranteed). Independent research should always be done to ensure that a combination of two or more substances is safe before consumption. It is strongly recommended that one use harm reduction practices, such as volumetric dosing, when using this substance so as to ensure the accurate administration of the intended dose.
Effect Profile
Curated + 414 ReportsStrong visuals, auditory effects, and headspace with strong body load
Duration Timeline
BluelightEmpirical Duration
Erowid ReportsMedian times after the dose that Erowid reports state. A curve is drawn only when reports state all four points (onset, peak begins, comedown begins, back to baseline) and the medians fall in that order. No point is estimated from another.
Community Effects
TripSitTolerance & Pharmacokinetics
drugs.wikiTolerance Decay
Subjective tolerance to classical psychedelics rises acutely and tends to decrease substantially over 3–7 days and return near baseline by 1–2 weeks; cross‑tolerance across serotonergic psychedelics is common, though exact ratios are not quantified.
Demographics
Gender Distribution
Age Distribution
Reports Over Time
Effect Analysis
Erowid + BluelightEffects aggregated from 322 experience reports (272 single-substance Erowid + 142 Bluelight)
Effect Sentiment Distribution
Confidence Distribution
Each bar is the share of reports mentioning the effect; its whisker, and the band on the rows below, is the 95% interval: where the share could plausibly be with other reports of the same kind.
Positive Effects 77
Adverse Effects 45
Show 23 more adverse effects
Show 35 neutral or unclassified mentions
Also reported in combinations. In the 236 2C-I reports where another drug was taken too, 22 (9.3%) mention hospital, emergency services or an overdose, 1 (0.4%) a seizure and 10 (4.2%) psychosis. In the 272 single-substance reports: 5.1%, 0.7% and 2.2%. These are not in the figures above: they cannot be put down to 2C-I alone, and a mention is not always something that happened to the writer.
Dose-Response Correlation
How effect frequency changes across dose levels. Whiskers, and the numbers' hover text, give each figure's 95% interval.
Not drawn, too few reports (a dose tier needs 20): Oral Light (n=11), Oral Heavy (n=15). Why 20?
View data table
| Effect | Common (n=56) | Strong (n=56) |
|---|---|---|
| Visual Distortions | 85.7% (95% interval 74 to 93 percent) | 89.3% (95% interval 78 to 95 percent) |
| Stimulation | 69.6% (95% interval 57 to 80 percent) | 48.2% (95% interval 36 to 61 percent) |
| Color Enhancement | 53.6% (95% interval 41 to 66 percent) | 66.1% (95% interval 53 to 77 percent) |
| Music Enhancement | 50.0% (95% interval 37 to 63 percent) | 53.6% (95% interval 41 to 66 percent) |
| Euphoria | 48.2% (95% interval 36 to 61 percent) | 46.4% (95% interval 34 to 59 percent) |
| Empathy | 39.3% (95% interval 28 to 52 percent) | 48.2% (95% interval 36 to 61 percent) |
| Anxiety | 37.5% (95% interval 26 to 51 percent) | 44.6% (95% interval 32 to 58 percent) |
| Sedation | 30.4% (95% interval 20 to 43 percent) | 39.3% (95% interval 28 to 52 percent) |
| Confusion | 28.6% (95% interval 18 to 42 percent) | 39.3% (95% interval 28 to 52 percent) |
| Closed-Eye Visuals | 26.8% (95% interval 17 to 40 percent) | 28.6% (95% interval 18 to 42 percent) |
| Nausea | 26.8% (95% interval 17 to 40 percent) | 23.2% (95% interval 14 to 36 percent) |
| Introspection | 26.8% (95% interval 17 to 40 percent) | 26.8% (95% interval 17 to 40 percent) |
| Auditory Effects | 25.0% (95% interval 16 to 38 percent) | 21.4% (95% interval 13 to 34 percent) |
| Open-Eye Visuals | 5.4% (95% interval 2 to 15 percent) | 23.2% (95% interval 14 to 36 percent) |
| Tactile Enhancement | 12.5% (95% interval 6 to 24 percent) | 21.4% (95% interval 13 to 34 percent) |
Subjective Effect Ontology
Experience ReportsStructured effect tags extracted from 558 Erowid & Bluelight experience reports using a controlled vocabulary of 220+ canonical effects across 15 domains.
Auditory
Cognitive
Emotional
Gastrointestinal
Motor
Somatic
Tactile
Visual
Dose–Effect Mapping
Experience ReportsHow reported effects shift across dose tiers, based on 272 single-substance experience reports. The shaded band on each bar is its 95% interval. An arrow (↑ ↓) marks a change between the lowest and highest tier that count an effect only when the gap is bigger than chance would explain; ~ means no clear change. How changes are called
Not drawn, too few reports (a dose tier needs 20): Oral Light (n=11), Oral Heavy (n=15). Why 20?
Limited tier coverage — most reports fall within the Common / Strong range. Effects at other dose levels may not be represented.
| Effect | Common (n=56) | Strong (n=56) | Change with dose |
|---|---|---|---|
| visual distortions | (no clear change: +4 points from Common to Strong, 95% interval −9 to +16) | ||
| stimulation | (−21 points from Common to Strong, 95% interval −38 to −3) | ||
| color enhancement | (no clear change: +12 points from Common to Strong, 95% interval −6 to +29) | ||
| music enhancement | (no clear change: +4 points from Common to Strong, 95% interval −14 to +21) | ||
| euphoria | (no clear change: −2 points from Common to Strong, 95% interval −20 to +16) | ||
| empathy | (no clear change: +9 points from Common to Strong, 95% interval −9 to +26) | ||
| anxiety | (no clear change: +7 points from Common to Strong, 95% interval −11 to +24) | ||
| sedation | (no clear change: +9 points from Common to Strong, 95% interval −8 to +26) | ||
| confusion | (no clear change: +11 points from Common to Strong, 95% interval −7 to +27) | ||
| closed-eye visuals | (no clear change: +2 points from Common to Strong, 95% interval −15 to +18) | ||
| nausea | (no clear change: −4 points from Common to Strong, 95% interval −19 to +12) | ||
| introspection | (no clear change: 0 points from Common to Strong, 95% interval −16 to +16) | ||
| auditory effects | (no clear change: −4 points from Common to Strong, 95% interval −19 to +12) | ||
| open-eye visuals | (+18 points from Common to Strong, 95% interval +5 to +31) | ||
| tactile enhancement | (no clear change: +9 points from Common to Strong, 95% interval −5 to +23) | ||
| body high | (no clear change: +4 points from Common to Strong, 95% interval −11 to +18) | ||
| dissociation | (no clear change: −5 points from Common to Strong, 95% interval −19 to +8) | ||
| muscle tension | (no clear change: −2 points from Common to Strong, 95% interval −16 to +12) | ||
| pupil dilation | (no clear change: +5 points from Common to Strong, 95% interval −8 to +18) | ||
| ego dissolution | (no clear change: 0 points from Common to Strong, 95% interval −13 to +13) |
Showing top 20 of 32 effects
Risk Escalation
Sentiment AnalysisAverage frequency of positive vs adverse effects across dose tiers. A tier's average is the mean share of the effects counted in that tier, not a share of reports, and its range is a deliberately wide 95% interval. A tier with more reports also counts rarer effects, which pulls its average down, so compare single effects in the breakdown rather than these averages. There, the shaded band on each bar is its 95% interval, and Change is marked up or down only when the gap between two tiers is bigger than chance would explain. How changes are called
Not drawn, too few reports (a dose tier needs 20): Light (n=11), Heavy (n=15). Why 20?
View effect breakdown
Adverse Effects
| Effect | Common (n=56) | Strong (n=56) | Change |
|---|---|---|---|
| Anxiety | no clear change (no clear change: +7 points from Common to Strong, 95% interval −11 to +24) | ||
| Confusion | no clear change (no clear change: +11 points from Common to Strong, 95% interval −7 to +27) | ||
| Nausea | no clear change (no clear change: −4 points from Common to Strong, 95% interval −19 to +12) | ||
| Muscle Tension | no clear change (no clear change: −2 points from Common to Strong, 95% interval −16 to +12) | ||
| Pupil Dilation | no clear change (no clear change: +5 points from Common to Strong, 95% interval −8 to +18) | ||
| Jaw Clenching | no clear change (no clear change: −2 points from Common to Strong, 95% interval −14 to +10) | ||
| Headache | no clear change (no clear change: +4 points from Common to Strong, 95% interval −8 to +15) | ||
| Motor Impairment | no clear change (no clear change: −2 points from Common to Strong, 95% interval −13 to +9) | ||
| Memory Suppression | no clear change (no clear change: +5 points from Common to Strong, 95% interval −5 to +16) | ||
| Thought Loops | — | — | |
| Appetite Suppression | — | — | |
| Sweating | — | — | |
| Increased Heart Rate | no clear change (no clear change: 0 points from Common to Strong, 95% interval −9 to +9) |
Positive Effects
| Effect | Common (n=56) | Strong (n=56) | Change |
|---|---|---|---|
| Visual Distortions | no clear change (no clear change: +4 points from Common to Strong, 95% interval −9 to +16) | ||
| Stimulation | −21 pts (−21 points from Common to Strong, 95% interval −38 to −3) | ||
| Color Enhancement | no clear change (no clear change: +12 points from Common to Strong, 95% interval −6 to +29) | ||
| Music Enhancement | no clear change (no clear change: +4 points from Common to Strong, 95% interval −14 to +21) | ||
| Euphoria | no clear change (no clear change: −2 points from Common to Strong, 95% interval −20 to +16) | ||
| Empathy | no clear change (no clear change: +9 points from Common to Strong, 95% interval −9 to +26) | ||
| Closed-Eye Visuals | no clear change (no clear change: +2 points from Common to Strong, 95% interval −15 to +18) | ||
| Introspection | no clear change (no clear change: 0 points from Common to Strong, 95% interval −16 to +16) | ||
| Open-Eye Visuals | +18 pts (+18 points from Common to Strong, 95% interval +5 to +31) | ||
| Tactile Enhancement | no clear change (no clear change: +9 points from Common to Strong, 95% interval −5 to +23) | ||
| Body High | no clear change (no clear change: +4 points from Common to Strong, 95% interval −11 to +18) | ||
| Focus Enhancement | no clear change (no clear change: +4 points from Common to Strong, 95% interval −9 to +16) | ||
| Creativity Enhancement | no clear change (no clear change: −2 points from Common to Strong, 95% interval −12 to +8) |
Dosage Distribution
Dose distribution from experience reports, one dose per report (the first listed). Doses above Q3 + 3×IQR, far above what people typically take, are left out of the median and range and listed under each route: most are real heavy doses or overdoses, not mistakes.
Oral
15 reports gave a dose above the typical range (45–250 mg), so they are not in the figures above. 5 of them mention hospital, emergency services or an overdose. Listing a dose here does not mean it is safe.
Show the reports
- 250 mg · mentions hospital, emergency services or an overdose
- 120 mg · another drug taken too · mentions hospital, emergency services or an overdose
- 100 mg
- 100 mg
- 100 mg
- 90 mg · another drug taken too
- 80 mg · another drug taken too · mentions hospital, emergency services or an overdose
- 75 mg
- 70 mg · another drug taken too
- 60 mg · another drug taken too
- 55 mg · another drug taken too · mentions hospital, emergency services or an overdose
- 55 mg · another drug taken too
- 50 mg · another drug taken too
- 50 mg · another drug taken too · mentions hospital, emergency services or an overdose
- 45 mg · another drug taken too
Insufflated
Real-World Dose Distribution
ErowidFrom 541 of 591 recorded dose entries: those that state a weight (mg, g or µg), in routes with at least five of them. Values above Q3 + 3×IQR, far above what people typically take, are left out; they can include real heavy doses and overdoses, not only mistakes.
Oral (n=466)
Insufflated (n=42)
Smoked (n=9)
Common Combinations
Most co-occurring substances, as a share of all 508 reports filed under 2C-I; whiskers are 95% intervals
Form / Preparation
Most common forms and preparations, as a share of the 355 reports that give one; whiskers are 95% intervals
Body-Weight Dosing
Dose per kg of body weight, one dose per report (the first listed), from reports giving a weight of 30–250 kg. Doses above Q3 + 3×IQR, far above what people typically take, are left out of the median and range and listed under each route.
Oral
18 reports gave a dose above the typical range (0.63–3.571 mg/kg), so they are not in the figures above. 5 of them mention hospital, emergency services or an overdose. Listing a dose here does not mean it is safe.
Show the reports
- 3.571 mg/kg · mentions hospital, emergency services or an overdose
- 2.116 mg/kg · another drug taken too · mentions hospital, emergency services or an overdose
- 1.471 mg/kg
- 1.471 mg/kg · another drug taken too
- 1.337 mg/kg
- 1.14 mg/kg
- 1.038 mg/kg · another drug taken too · mentions hospital, emergency services or an overdose
- 0.833 mg/kg · another drug taken too · mentions hospital, emergency services or an overdose
- 0.8 mg/kg · another drug taken too
- 0.794 mg/kg · another drug taken too
- 0.787 mg/kg · another drug taken too
- 0.735 mg/kg
- 0.733 mg/kg · another drug taken too · mentions hospital, emergency services or an overdose
- 0.705 mg/kg
- 0.705 mg/kg · another drug taken too
- 0.701 mg/kg · another drug taken too
- 0.678 mg/kg
- 0.63 mg/kg
Insufflated
Smoked
Unknown
1 report gave a dose above the typical range (0.551 mg/kg), so it is not in the figures above. Listing a dose here does not mean it is safe.
Show the report
- 0.551 mg/kg · another drug taken too
Redose Patterns
Redosing behavior across 377 reports
Legal Status
| Country | Status | Notes |
|---|---|---|
| Australia | Schedule 9 | Prohibited substance under the Poisons Standard. The National Drugs and Poisons Schedule Committee formally added 2C-I to Schedule 9 (the most restrictive category) in 2005. |
| Austria | Illegal (SMG) | Controlled under the Suchtmittelgesetz (Narcotics Act). Possession, production, and sale are prohibited. |
| Belgium | Illegal | Added to the list of illegal psychotropic substances on November 8, 2004. |
| Brazil | Illegal | Possession, production, and sale prohibited under Portaria SVS/MS nº 344. Controlled as of February 18, 2014. |
| Canada | Schedule III (CDSA) | Controlled under the Controlled Drugs and Substances Act as of October 31, 2016. |
| China | Category I Psychotropic Substance | Illegal to sell, buy, import, export, and manufacture as of September 2010. |
| Czech Republic | Controlled | Added to controlled substance lists in early 2011 alongside BZP, synthetic cannabinoids, and various cathinone derivatives. |
| Denmark | Controlled | Classified as a controlled substance since May 2002. |
| Estonia | Schedule I | Added to Schedule I in February 2011 alongside various synthetic cathinones and cannabinoids. |
| Finland | Illegal | Scheduled under the government decree on substances, preparations, and plants considered to be narcotic drugs. |
| France | Controlled | Added to the list of controlled substances in August 2004 as a synthetic analogue of mescaline. |
| Germany | Anlage I BtMG | Controlled under Anlage I of the Betäubungsmittelgesetz (Narcotics Act) as of October 10, 1999. Manufacturing, possession, import, export, purchase, sale, procurement, and dispensing without license are prohibited. |
| Greece | Controlled | Illegal to possess under Table A of Law 1729/87. |
| Ireland | Schedule 1 | Controlled as a Schedule 1 substance, prohibiting possession and distribution. |
| Israel | Controlled | Added to the list of controlled substances in December 2007, making purchase, sale, and possession illegal. |
| Italy | Tabella I | Added to Tabella 1 (list of prohibited plants and substances) by Ministry of Health statement on January 11, 2005. |
| Japan | Designated Substance (Shitei-Yakubutsu) | Controlled under the Pharmaceutical Affairs Law, making possession and sale illegal. |
| Latvia | Schedule I | Classified as a Schedule I controlled substance. |
| Netherlands | Controlled | Classified as a controlled substance under national drug legislation. |
| New Zealand | Schedule 3 / Class C | Controlled under the catch-all analogues provision in Schedule 3 / Class C of national drug laws. |
| Poland | Controlled | Classified as a controlled substance under national drug legislation. |
| Portugal | Controlled | Legislation enacted in January 2005 to control 2C-I alongside 2C-T-2, 2C-T-7, and TMA-2. |
| Sweden | Schedule I (Narcotic) | Added to Schedule I by Sveriges riksdag on March 16, 2004, published in Medical Products Agency regulation LVFS 2004:3. Classified as a substance normally without medical use. |
| Switzerland | Controlled (Verzeichnis D) | Listed in Anhang D of the Betäubungsmittelverzeichnisverordnung (DetMV) since December 12, 1996. Possession is illegal. |
| Turkey | Illegal | Classified as a drug. Possession, production, supply, and import are prohibited. |
| United Kingdom | Class A | Controlled under the Misuse of Drugs Act 1971 via the phenethylamine catch-all clause. Class A carries the most severe penalties for possession and supply. |
| United States | Schedule I | Controlled under the Synthetic Drug Abuse Prevention Act of 2012, effective July 9, 2012. Possession, distribution, and manufacture are federal offenses. Several states including Minnesota, Oklahoma, and Wisconsin had scheduled the substance prior to federal action. |
Harm Reduction
drugs.wikiIdentity and misrepresentation: 2C‑I has often been confused with or sold as 25I‑NBOMe/NBOH; NBOMe compounds are active at microgram doses, can cause local oral numbness and intense bitterness, are not reliably active when simply swallowed, and have been linked to hospitalizations and deaths—test samples and avoid blotters claimed to be “2C‑I.” Use multiple reagents and, ideally, lab testing (FTIR/GC‑MS) when possible. Redosing: EMCDDA notes 2C‑I can have a slower onset than expected, which has led some users to prematurely redose or add other drugs; wait at least 2 hours after an oral dose before considering any change. Intranasal risks: snorting 2C‑x (including 2C‑I) is frequently reported as extremely painful and more likely to cause nausea, vomiting, and a harsh stimulant edge; many experienced users avoid the route—if used, reduce dose markedly and expect severe nasal irritation. Cardiovascular strain: phenomenology and receptor data (5‑HT2A/2C and potential alpha‑1 adrenergic action) imply vasoconstriction, mild tachycardia and blood‑pressure elevation; those with cardiovascular disease, hypertension, or migraine susceptibility should avoid use and all users should minimize exertion/overheating. Serotonergic/seizure‑threshold cautions: avoid combinations with MAOIs entirely and with tramadol due to seizure and serotonin‑toxicity risks; SSRIs/SNRIs may blunt effects and complicate response. Lithium is specifically flagged as dangerous with classical serotonergic psychedelics due to seizure risk; do not combine. Set and setting: stimulation can amplify anxiety—use with a trusted sober sitter in a calm environment; avoid crowded, hot venues on first trials. Hydration and temperature: sip water periodically (not excessively) and take cool breaks if active; overheating increases risk with stimulating psychedelics. Dosing discipline: always allergy test with a very small amount (e.g., 1–3 mg oral), then titrate across separate sessions using a 0.001 g scale; never eyeball. Sleep and after‑effects: residual stimulation can impair sleep into the next day; plan recovery time and do not drive or operate machinery for at least 12–24 hours after significant effects resolve. Legal and substitution risk: 2C‑I is Schedule I in the U.S. and controlled in many countries; the market has historically included mislabeling (including NBOMe and DOx) so reagent test each sample.
References
Data Sources
Cited References
Additional references
- Erowid 2C‑I Vault (overview; confusion with NBOMe)
- EMCDDA/Europol risk assessment on 2C‑I (delayed onset; receptor notes)
- Drugs‑Forum 2C‑I wiki (reagents; typical dosing mention)
- Bluelight: List of Dangerous & Potentially Unsafe Combinations (MAOIs with phenethylamine psychedelics; lithium cautions)
- TripSit Wiki: Tramadol (seizure and serotonergic risks)
- Bluelight NBOMe safety warning (mislabelled blotters; fatalities and unpredictability)
- Drugs‑Forum: Notice of intent to schedule NBOMe (reports of deaths)
- Drugs‑Forum: 2C‑I trip reports (onset and phenomenology; supports timing ranges)